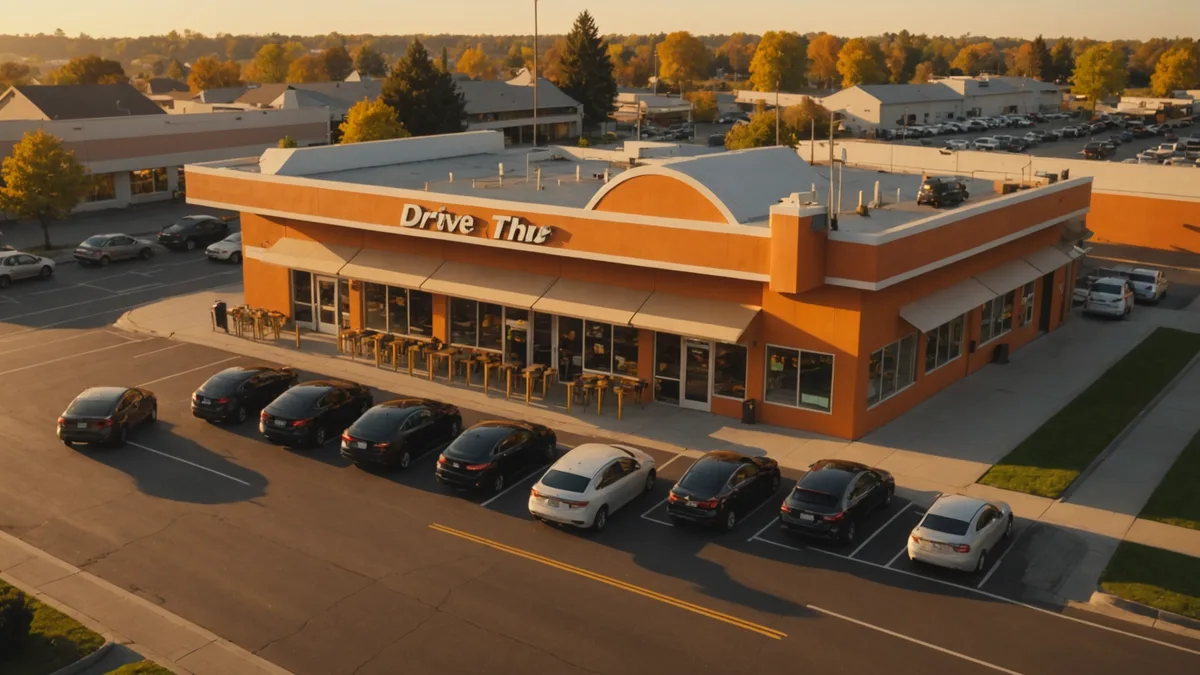
Every QSR operator knows what their annual revenue is. Very few can tell you their peak-hour order throughput — the number of orders processed per minute during the 60–90 minutes when their location is under maximum load. That gap is where profitability lives or dies.
Revenue at a QSR is not distributed evenly across operating hours. For most concepts, 35–45% of daily revenue comes in a 90-minute peak window at lunch and a similar window at dinner. The ceiling on that revenue isn't customer demand — it's throughput capacity. If your operation can handle 22 orders per hour at maximum and demand at 12:15 PM is 38 orders, you're leaving roughly $192 on the table every peak day at a $12 average ticket, assuming a 45-minute peak compressed within that hour. Annually, across 250 operating days, that's $48,000 in constrained revenue per location.
The number that predicts whether that gap will grow or shrink is peak-hour order throughput — specifically, how it compares to demonstrated demand.
What Throughput Actually Measures
Order throughput is orders completed per unit time. "Completed" means fully assembled, packaged, and handed to the customer — not entered into the POS. The gap between order entry and order completion is production time, which varies by menu complexity, kitchen configuration, and staffing. Throughput is the end-to-end rate, not a component rate.
Measuring it requires knowing when a customer interaction starts (car arrives at the order point, or customer reaches the counter) and when they leave with their order. Most POS systems don't capture this natively, but drive-thru timer systems (HME, Delphi, Stanchion) do. For counter service, you need either a timestamped token system or observation-based timing.
If you don't have timer data, you can approximate: divide your peak-hour order count by the number of peak minutes your location was operating. A location that did 85 orders between 11:45 AM and 1:15 PM was running at approximately 57 orders per 90 minutes, or 0.63 orders per minute, or 38 orders per hour. That's your starting benchmark.
The Throughput Ceiling: Where Constraints Actually Live
Most operators assume the kitchen is the constraint. Often it isn't. The constraint is more frequently one of three other places:
The order-taking bottleneck. At a drive-thru with one lane and one order-taker, the constraint may be how many cars can get through the ordering point per hour, not how fast the kitchen can cook. A car that spends 95 seconds at the speaker because the order is complicated or the customer is indecisive is a car that's blocking the queue. Average order-point time multiplied by peak demand determines whether you have a kitchen constraint or an order-taking constraint.
The payment bottleneck. In single-lane drive-thrus, payment at the window is often the tightest constraint. A customer who searches for cash, needs to split a payment, or asks a question at the payment window stalls the entire line regardless of kitchen status. Contactless payment adoption directly improves throughput by reducing average payment window dwell time.
The expediting bottleneck. When an order isn't ready at the pickup window, the line backs up. The frequency of "pull-forward" situations (where the customer is sent to a waiting space because their order isn't done) is a leading indicator of kitchen-side throughput failure. If more than 10–12% of orders require a pull-forward during peak, kitchen throughput is the real constraint.
Identifying which constraint is active determines what investment will move the throughput number. Adding a second cook when the constraint is order-taking doesn't help. Improving order-point speed when the constraint is kitchen assembly doesn't help.
The Phone Channel Throughput Problem
Drive-thru and counter throughput get measured and managed. Phone ordering throughput is almost universally ignored — even though at locations where phone orders represent 20–30% of daily volume, phone-channel throughput has direct bearing on peak performance.
Here's the mechanism: during peak, a phone order that comes in during the 90-minute lunch window adds to the kitchen load with no corresponding revenue benefit from the physical throughput of the drive-thru or counter. If your kitchen is already constrained, phone orders accepted during peak compress the available capacity for in-restaurant customers without proportionate revenue gain — because phone orders often require hold packaging and may add production complexity.
Some high-volume operators explicitly close phone ordering during peak windows for exactly this reason. Others prioritize phone orders with a slight production delay to smooth the kitchen load. Neither approach is clearly superior — the right call depends on your phone order percentage and your kitchen configuration. But not having a deliberate policy means peak phone volume interacts with your throughput constraints unpredictably.
A Concrete Scenario: Measuring to Find the Real Constraint
Consider a regional burger QSR with 14 seats and a drive-thru lane, running an average peak volume of about 120 orders in the 12–1:30 PM window (roughly 80 orders per hour, 1.33 per minute). The operator's complaint was inconsistent speed of service — sometimes the line moved well, sometimes it backed up severely with no obvious cause.
Installing drive-thru timers for one month revealed: average order-point time was 73 seconds, average payment window time was 38 seconds, average pickup window time was 52 seconds. Total average service time: 163 seconds, or 2.7 minutes per car. At 1.33 cars arriving per minute with 2.7 minutes average service time, the steady-state queue is 1.33 × 2.7 = 3.6 cars in process simultaneously. That's a manageable load for a single-lane operation.
But the variance was the problem. On the days when the line backed up badly, order-point time averaged 112 seconds — 53% higher than baseline. Those were days with more "difficult" orders: combos with multiple modifications, customers who didn't know what they wanted, family orders with multiple separate payments. The kitchen was fine. The order-taking bottleneck was eating the capacity buffer.
The fix wasn't more kitchen staff. It was a prompted ordering script (a structured confirmation flow that moved customers through their order faster), combined with upsell-on-confirmation rather than upsell-during-ordering (which was slowing the order-point conversation). Average order-point time dropped to 68 seconds over the following month, and the severe backup incidents dropped substantially. None of that required any technology investment beyond retraining one behavior.
The Relationship Between Throughput and Profitability
Throughput connects to profitability in two directions, and operators sometimes focus only on one.
Revenue upside from throughput improvement — if you're throughput-constrained at peak and there's demonstrated demand above your current capacity (evidenced by queue abandonment, pull-forwards, or wait times that drive customers away), then each order of throughput improvement is a direct revenue gain. If you process 80 orders per peak hour and move to 92, that's 12 additional orders at whatever your average ticket is, assuming demand is there.
Labor cost sensitivity to throughput — the flip side is that labor cost is largely fixed per peak hour (you have to staff the peak regardless of throughput). A location running 80 orders per hour peak with a labor cost structure designed for 100 has a cost-per-order problem, not just a revenue problem. Improving throughput is one lever; so is tightening the labor-to-throughput ratio by reducing the non-peak staffing that bleeds into peak.
We're not suggesting that throughput optimization is a substitute for every other improvement lever. Menu simplification, kitchen layout, equipment investment, and staffing model all interact. But peak-hour order throughput as a single tracked metric gives you a number to manage toward — and QSR locations that track it tend to make better investment decisions than ones that manage by intuition and aggregate revenue figures alone.
Getting Your Number
If you don't have drive-thru timers or a token system, start with a 5-day manual count: one person counts completed orders during the 12–1:30 PM window and notes the clock time when each car exits or each customer leaves. At the end of five days, you have a distribution of peak throughput rates. That distribution tells you your average, your variance, and (importantly) what your best days looked like — which is your realistic near-term ceiling.
The gap between your average peak throughput and your best-day peak throughput is your operational improvement opportunity. The gap between your best-day throughput and demonstrated demand above that ceiling is your capacity investment decision. Run both calculations before spending money on kitchen equipment, staffing changes, or ordering technology. The answers may surprise you.